Message from the CFO
1. Financial Policy
(1) Financial Policy in the 4th MTMP1
1. 4th Medium-Term Management Plan
➀ Financial Targets
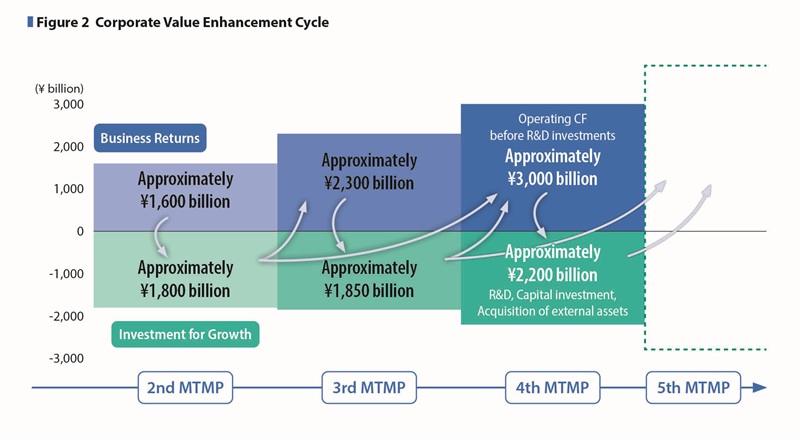
The Otsuka group has been investing the operating cash flow before R&D investments generated by its business activities in its pipeline, basic drug discovery technologies, initiatives to enhance the brand value of nutraceutical products and human resource development, which are all sources of growth, thereby generating new cash to fund future growth. Repeating this cycle of investment and growth has enabled us to achieve growth and enhance our corporate value.
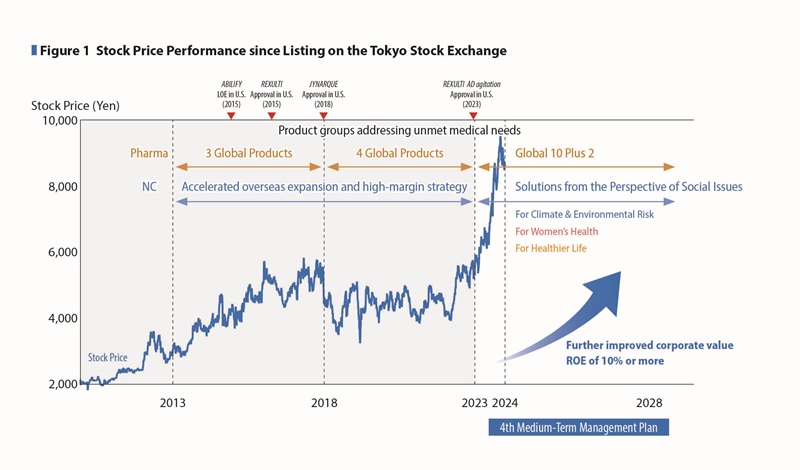
Looking at our stock price performance since listing on the Tokyo Stock Exchange, we have seen a steady increase in corporate value, which would imply our management decision to expand business area and to quickly recover from the impact of LOE in the Pharmaceutical Business has been accepted in the stock market. (See Figures 1, 2)
When we went public in December 2010, concerns were raised in the market about the U.S. patent expiration of ABILIFY in 2015. To respond to such concerns, since the expiration of the ABILIFY patent, we have diversified our revenue structure by developing 3 Global Products (ABILIFY MAINTENA, REXULTI, and Samsca/JINARC), next-generation products such as LONSURF, as well as implementing the high-margin strategy on the NC business.
Furthermore, the 3rd MTMP period has been positioned as a preparation period to deal with the patent expirations of ABILIFY MAINTENA and JYNARQUE and this challenge by nurturing the next growth drivers. Through these measures, as well as by expanding business and improving earnings through investment for growth, we were able to steadily enhance our ability to generate stable cash that exceeds our cost of capital.
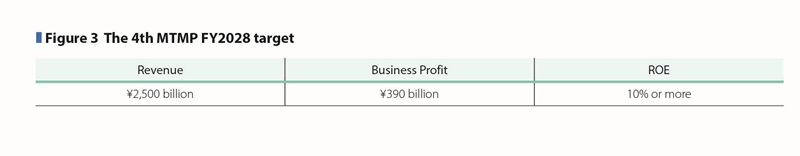
In the 4th MTMP period, we will actively make investment for future growth to mitigate the impact from loss of exclusivity on the Pharmaceutical Business and we will further develop our diversified business from a capital efficiency perspective. For FY2028 targets, we aim to achieve revenue of \2,500 billion, business profit before R&D expenses of \720 billion, business profit of \390 billion, EPS of 550 yen, operating cash flow before R&D investments of \650 billion, and capital efficiency with ROE of 10% or more, and ROIC of 9.5% or more. (See Figure 3)
➁ Cash Allocation
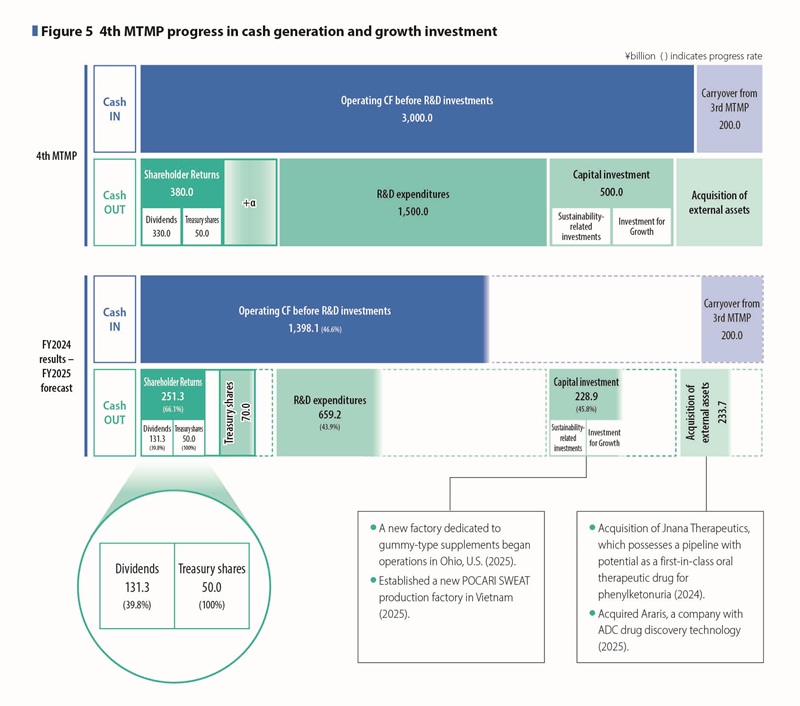
In the 4th MTMP we plan to secure funds of approximately \3,200 billion, which exceeds the amount in the 3rd MTMP period, by adding approximately \200 billion in cash and cash equivalents, an increase from the 3rd MTMP period, to the approximately \3 trillion in operating cash flow before R&D investments to be generated over the five-year period.
About \1.5 trillion for R&D is planned to be invested mainly in the fields of psychiatry and neurology, oncology, and cardiovascular and renal disease to advance basic research and late-stage clinical development that will become fundamental technologies for drug discovery in the Pharmaceutical Business.
In addition, in the Nutraceutical Business we plan to continuously invest in the development of new products. Of the approximately \500 billion in capital expenditures, about half will be used for investment for growth, such as increasing production capacity to meet the demand of POCARI SWEAT in high-growth overseas markets, while the remaining half will be invested in the maintenance and renewal of existing facilities in an environmentally friendly manner. (See Figure 5)
In acquisition of external assets, we will acquire pipelines that will contribute to growth in the 5th and 6th MTMPs, as well as acquire and collaborate on drug discovery technologies to continuously generate pipelines, and expand our portfolio of pharmaceutical products in therapeutic areas that can contribute to social issues more broadly, based on our current strengths. From a regional perspective, we will not only expand our global pipeline including the U.S., but also acquire external assets in specific regions such as Japan, Asia, and Europe, taking into consideration the acquisition of pipelines that will allow us to utilize our own sales network.
(2) Progress of the 4th MTMP
➀ Financial targets
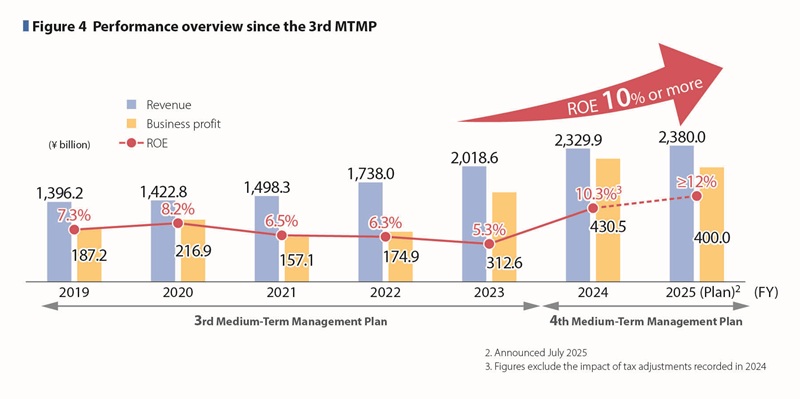
In FY2024, both the Pharmaceutical and Nutraceutical Businesses performed strongly. Revenue increased by 15.4% year-on-year to \2,329.9 billion, driven primarily by contributions from the Core 2 products (“REXULTI” and “LONSURF”), “JINARC,” “ABILIFY MAINTENA,” and the overseas Nutraceutical Business, which are key growth drivers under the 4th MTMP period. Business profit rose by 37.7% year-on-year to \430.5 billion. In the first year of the 4th MTMP, we achieved our highest record in revenue and all profit metrics.
As capital efficiency indicators adopted under the 4th MTMP, we achieved 13.4% of ROE and 11.9% of ROIC respectively in FY2024. Even excluding the one-time tax adjustment that occurred during the year, ROE was 10.3% and ROIC was 9.2%, significantly exceeding the capital cost benchmark of 6% assumed in the plan.
In FY2025, we expect continued growth in both the Pharmaceutical and Nutraceutical Businesses, with revenue projected to increase by 2.2% to \2.38 trillion. Although we encounter significant impact from the sharp drop of sales of JYNARQUE with loss of exclusivity (LOE) for our key product, contributions from both business segments are expected to cover this negative impact, and excluding foreign exchange effects, business profit is expected to increase by approximately \36 billion year-on-year, and overall, the business is projected to progress steadily.
Meanwhile, we plan to actively invest in growth drivers that will contribute to our sales in the 5th MTMP and beyond, including new clinical trials for repinatrabit (phenylketonuria) and zipalertinib (non-small cell lung cancer). These efforts will focus on the “Next 8” pipeline: ulotaront, centanafadine, uRDN, sibeprenlimab, LYTGOBI, zipalertinib, INQOVI, and ASTX030.
Business profit before R&D expenses is expected to reach \745 billion, significantly exceeding the original FY2025 target in the 4th MTMP, indicating steady overall business growth.
ROE and ROIC, capital efficiency indicators are expected to exceed 12%.
While current performance is exceeding the 4th MTMP targets (See Figure 4), we remain vigilant of uncertainties such as U.S. tariff policies and pharmaceutical regulations, and will continue to monitor the business environment closely and respond flexibly with speed to minimize any impact.
➁ Progress in cash generation and growth investment
In FY2024, cash generation was driven primarily by the Core 2 products in the Pharmaceutical Business. While the LOE of JYNARQUE will have a negative impact in FY2025, REXULTI, ASIMTUFII, and Plus 2 products—Kisqali and Pluvicto—are expected to continue to grow and support future cash generation, which exceeds the initial plan under the 4th MTMP.
Cumulative operating cash flow before R&D investments through FY2025 is projected to reach approximately \1,400 billion, representing a 46.6% progress toward the five-year target. (See Figure 5)
With regards to investments for growth beyond the 5th MTMP, clinical development trials have progressed on track, and R&D expenditures have reached \659.2 billion, representing 43.9% progress. Cumulative capital expenditures have reached \228.9 billion, achieving 45.8% progress. (See Figure 5)
To meet the growing demand for supplements in the U.S., we have built a new factory in Ohio in March 2025, where a gummy-type supplement is manufactured.
Additionally, to meet the growing demand for POCARI SWEAT in the rapidly growing Asian market, we established a new factory in Vietnam, which commenced operations in April 2025.
Regarding the acquisition of external assets, in 2024, Otsuka Pharmaceutical acquired Jnana Therapeutics, which possesses an innovative drug discovery approach and a pipeline with potential as a first-in-class oral therapeutic drug for phenylketonuria. In 2025, Taiho Pharmaceutical, a specialty pharma company focused on oncology with a cysteinomics-based drug discovery platform, acquired Araris, a company with ADC drug discovery technology.
Regarding the basic policy for acquiring external assets, as I have explained so far, we are considering investment opportunities in the areas that are in line with our long-term strategy and can create synergies with our existing management assets.
2. Initiatives to Enhance Corporate Value
(1) Framework of Financial Strategies to Support New Value Creation
➀ Source of funds for investment for growth
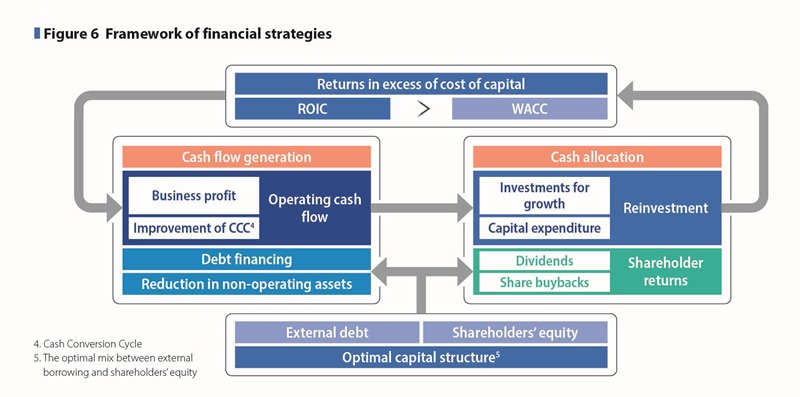
In principle, investment for growth is funded through the reinvestment of cash returns generated from businesses, and funds within the Otsuka group are effectively used across business segments, using funds from the cash management system in Japan, North America, and China. Where external procurement of cash is required, we are always prepared to implement the full range of options, including commercial paper, corporate bonds, bank loans, and share issues. To ensure our ability to act in a timely manner on business opportunities when they arise, we are prepared for the risk that financial uncertainty in the market may cause some procurement methods to become unavailable. We are also considering the issuance of green bonds during the period of the 4th MTMP as not only a part of our efforts to promote sustainability management but also new procurement options in addition to the current available ones. (See Figure 6)
➁ Allocation of funds for investment for growth
At the Otsuka group, we place high importance on contributing to society through innovation, and we continue to pursue investment projects that enhance corporate value and address social challenges. Our basic policy for acquiring external assets remains unchanged: we invest in areas aligned with our longterm strategy and capable of generating synergies with existing management assets.
Specific examples of investment reallocation include the Pharmaceutical Business, where we invest in drug discovery technologies and collaborations that continuously generate pipelines, as well as sustained R&D investments to strengthen products and pipelines in key areas such as psychiatry and neurology, oncology, and cardiovascular and renal diseases. We also invest in new treatment options such as the ultrasound renal denervation (uRDN) system in the cardiovascular and renal fields.
In the Nutraceutical Business, we invest in expanding sales channels into new regions, building brand value by promoting new product benefits, and strengthening production and sales infrastructure. (See Figure 6)
(2) Business Management with a Corporatewide Awareness of Capital Cost
ROIC management, which supports Otsuka’s innovation, is considered a key initiative not only for improving short-term capital efficiency but also for enhancing corporate value over the medium to long term. From a financial perspective, we believe that establishing a stable financial foundation is essential to continue delivering on “what only Otsuka can do,” which ultimately contributes to society through innovation.
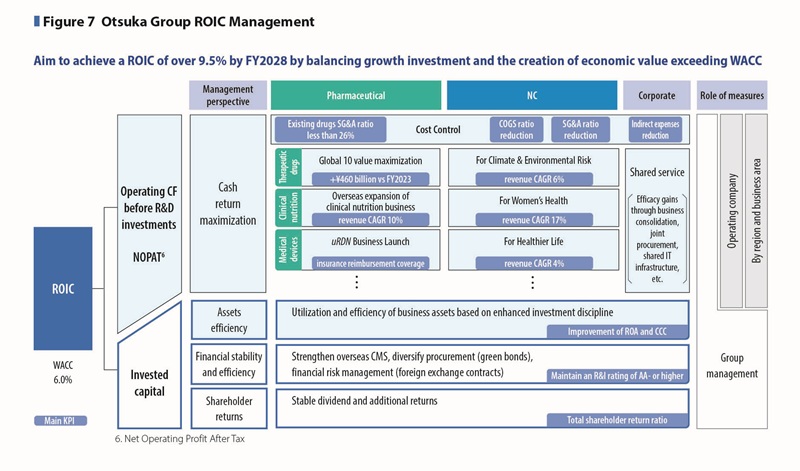
During the 4th MTMP period, we have set our cost of capital at 6% and are fully implementing ROIC management. The core measures to improve ROIC include maximizing cash returns from operations (operating cash flow before R&D investments) and optimizing invested capital.
➀ Maximizing cash return
To maximize cash return, we set KPI targets tailored to the characteristics of each business: therapeutic drugs, clinical nutrition, and medical devices in the Pharmaceutical Business, and business development in growth markets in the Nutraceutical Business. We implement KPI management to drive business performance.
In addition, we continue to enhance cost control measures initiated before the 3rd MTMP and advance shared service initiatives across regions. (See Figure 7)
➁ Optimization of invested capital
Optimization of invested capital is carried out through three pillars: asset efficiency, financial stability and efficiency, and shareholder returns. (See Figure 7)
Asset efficiency enhancement
We aim to improve ROA by enhancing the control of business assets across the Group, based on disciplined investment practices and optimal utilization of assets. In addition, we strive to optimize working capital by improving the management of accounts receivable and inventory, thereby shortening the Cash Conversion Cycle. For non-business assets, we promote the regular review and reallocation of strategic shareholdings to enhance the quality of invested capital.
Financial stability and efficiency
To ensure financial stability, we aim to maintain an R&I credit rating of AA- or higher by diversifying funding sources—including the issuance of green bonds when external financing is required—and by implementing financial risk management measures such as foreign exchange hedging. For financial efficiency, we seek to reduce interest-bearing debt by controlling standby funds through the use of a Cash Management System (CMS), thereby enhancing capital efficiency.
Shareholder returns
Our shareholder return policy is to steadily implement annual dividend payments and share buybacks during the period of the 4th MTMP with our cash allocation strategy. Even under an uncertain business environment—such as U.S. tariff and drug pricing policies—we place high priority on maintaining stable annual dividends as a key medium- to long-term shareholder return initiative.
At the same time, we remain committed to growth investments, including R&D, capital expenditures, and strategic acquisitions. While these investments are primarily funded by cash generated from operations, we also maintain the flexibility to secure additional funding as needed, based on strategic priorities, to ensure we do not miss growth opportunities.
In FY2024, we’ve generated cash exceeding the targets in the 4th MTMP as a result of strong business performance. In FY2025, the operating cash flow before R&D investment is expected to exceed the budget announced in February 2025. We have implemented buybacks of our share for approximately \50 billion as a consequence of cash generated from organic business growth during the 3rd MTMP. With continued robust and steady performance from FY2024, we have made an additional \70 billion of share buybacks approximately in March 2025.
Going forward, we will continue to flexibly consider shareholder returns from multiple perspectives, including upside in cash generation, progress in growth investments, and key return indicators such as total shareholder return ratio and return on equity.